By: Megan Van Schaik, Beef Cattle Specialist (OMAFRA); Andrew McDonald, Beef Cattle Livestock Assistant (OMAFRA); Madeline McLennan, Feed Ingredient and By-Product Assistant (OMAFRA)
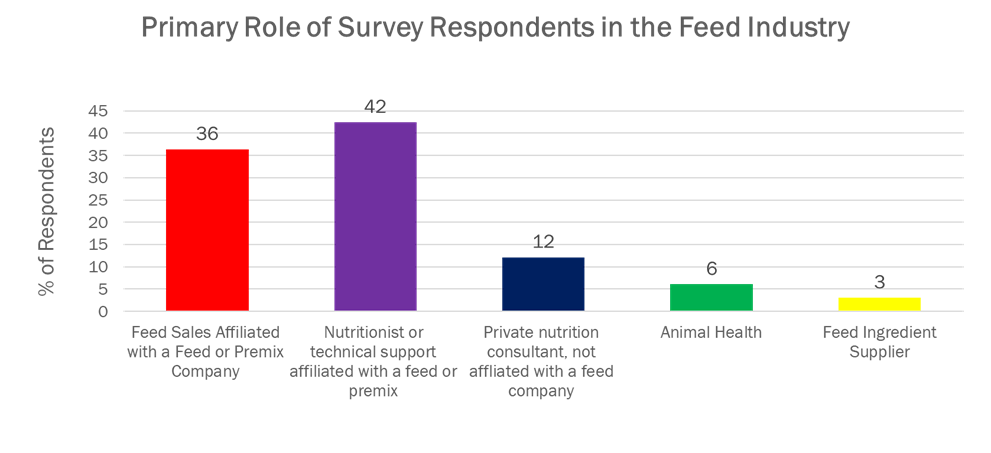
In May of 2021, a survey was conducted to better understand Ontario feedlot practices and feed industry advice, particularly around feeding management and management of incoming cattle. The survey was jointly coordinated by the Ontario Corn-Fed Beef Program, the Ontario Agri-Business Association, and the Ontario Ministry of Agriculture, Food and Rural Affairs. Feed industry professionals were surveyed on their experiences and perceptions related to Ontario’s feedlot sector with a focus on feeding and management practices. Survey respondents represented multiple tiers of the feed industry, including feed sales representatives, nutritionists, consultants, feed ingredient suppliers, and animal health advisors (figure 1).
This multi-tier response meant that the number of Ontario cattle were accounted for more than once, and thus the data is best interpreted to reflect the perspectives and approaches of individual respondents (advisors). Inconsistencies in the weighting of responses by cattle numbers may suggest that producers may be receiving varying advice from different advisors, while not all advisors may have a clear picture of practices adopted on farm. Despite these realities of the dataset, there are learning opportunities to benchmark feedlot practices and/or advice given for feeding and other management practices, identify knowledge gaps in the sector, and reflect on practices that can improve the overall cattle feeding sector in Ontario.
Survey respondents and their advice on feedlots
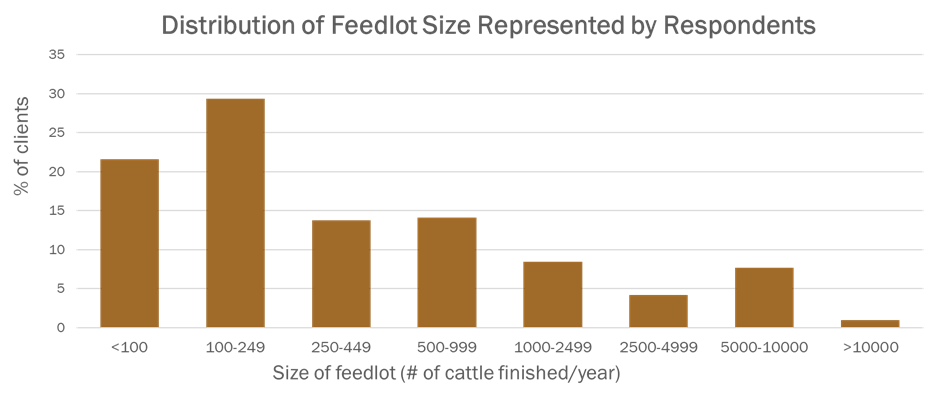
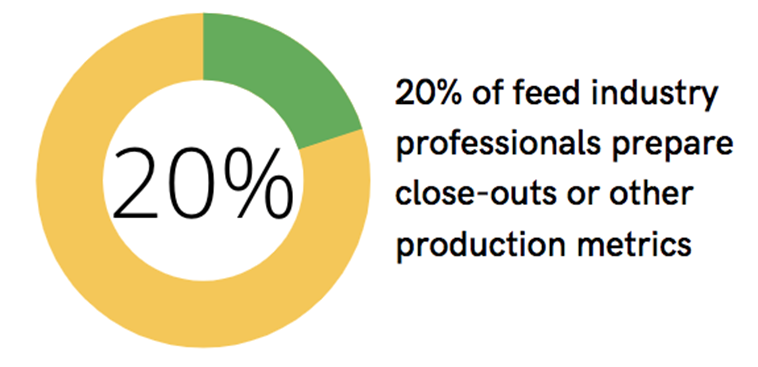
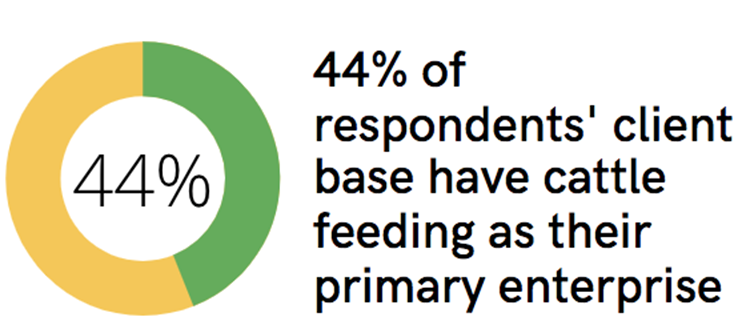
On average, 38% of the client base of survey respondents consisted of beef feedlot producers, which suggests that beef feedlot is not consistently the primary business across feed industry professionals participating in the survey. It is important to note that it was a requirement that survey respondents had some feedlot business to participate. The distribution of feedlot size represented by survey respondents, measured in number of cattle finished per year, is largely what would be expected based on Ontario’s feedlot sector, with representation skewed more heavily towards small and medium sized feedlots (figure 2). With regards to pen close-outs and other production metrics for feedlot operators, only about 20% of the respondents help to prepare this feedback for nutrition programs (figure 3). This represents a potential gap in evaluating feeding programs and management approaches, initiating any corrective actions, and making informed decisions to improve performance on Ontario feedlots.
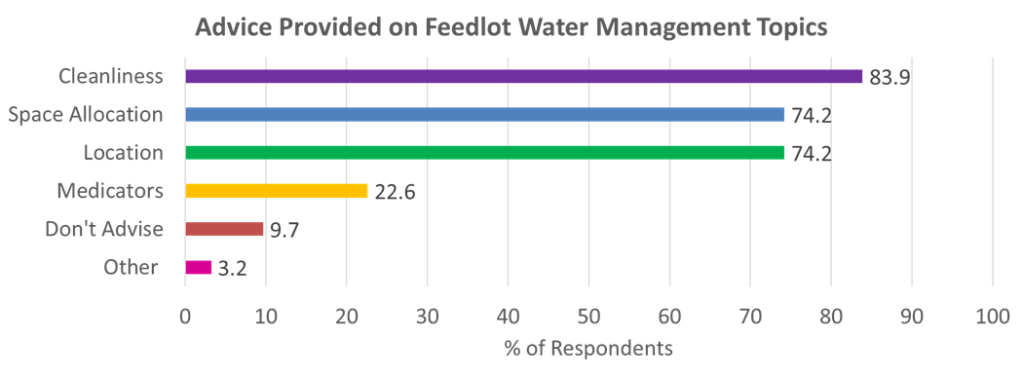
Water management is an important but often overlooked management consideration across livestock farms. When it comes to feedlot water management, the vast majority of respondents focus on cleanliness, space allocation, and location of waterers. A notable proportion of respondents (9.7%) don’t pay attention to water management at all, representing an oversight gap in an important practice for feedlots (figure 4).
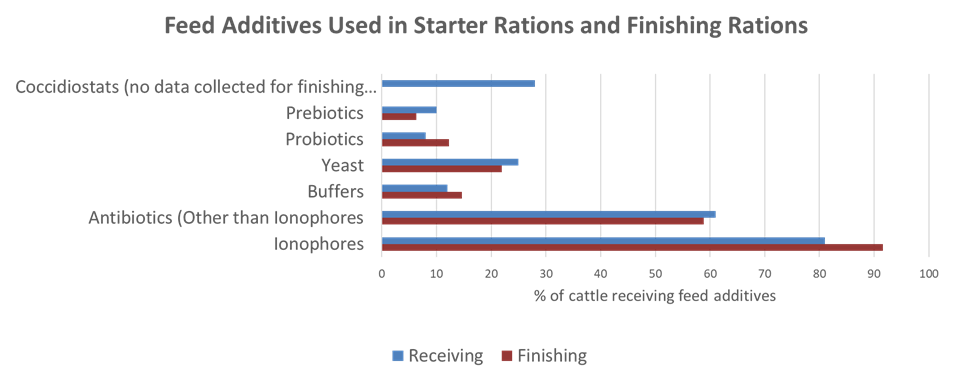
Respondents reported that fed antibiotic use was reduced in 35% of their feedlot clients over the past 10 years on average (figure 5). Figure 6 shows the average proportion of antibiotic and non-antibiotic feed additives used on feedlots, as reported by feed advisor survey respondents, comparing receiving and finishing programs. Ionophores are used ubiquitously across the feedlot sector in both receiving and finishing rations. Other categories of antibiotics came in a close second to ionophore use, with uptake of other non-antibiotic feed additives including yeast, buffers, prebiotics and probiotics trailing behind at 25% use or less.

General feeding and management practices – Ontario feedlot operators
This next section focuses on responses pertaining to general feeding and management practices adopted by feedlot operators in Ontario, as reported by feed industry professionals. On average 56% of feedlot operators represented in this survey through their advisors have other farm enterprises or off-farm jobs, which means that these feedlot operators have other business activities and focuses outside of the feedlot (figure 7). In other words, full time feeders are the minority in Ontario. This is an important consideration for feedlot advisors when gathering intel on what is happening on farm (especially in terms of cattle behaviours and bunk management practices) and advice provided.
Tools to read bunks and aid with ration adjustments are known to help feedlot operators fine-tune their feeding programs, keep cattle on feed consistently, improve dry matter intake (DMI), mitigate risk of digestive upsets, and help improve cattle performance. However, respondents reported on average that only 19% of their producer clients are using some form of bunk scoring system as part of bunk management (figure 8). On average, survey respondents indicated that 66% of their clients understand the importance of consistency in timing for feeding (figure 9). This is an important aspect of feed bunk management, especially during the critical times when new arrival start-up rations and high energy finishing rations are offered. Eighty-one percent of respondents reported having regular dialogue with clients about feed push-ups, where feed push-ups were necessary in a flat/table bunk or drop bunk situation.
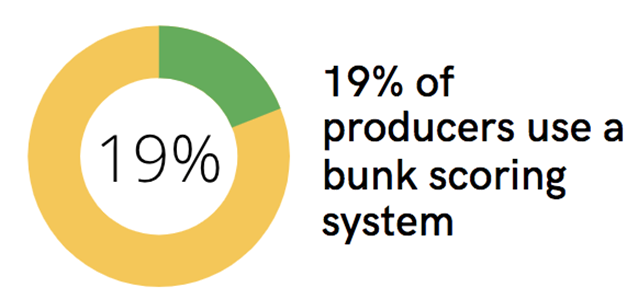
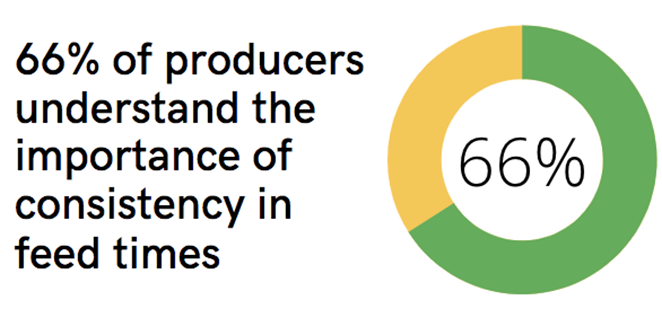
Figure 9. A representation of beef feedlot operator understanding of the importance of consistent feeding times (shown in green), based on feed advisor observations (n=32).
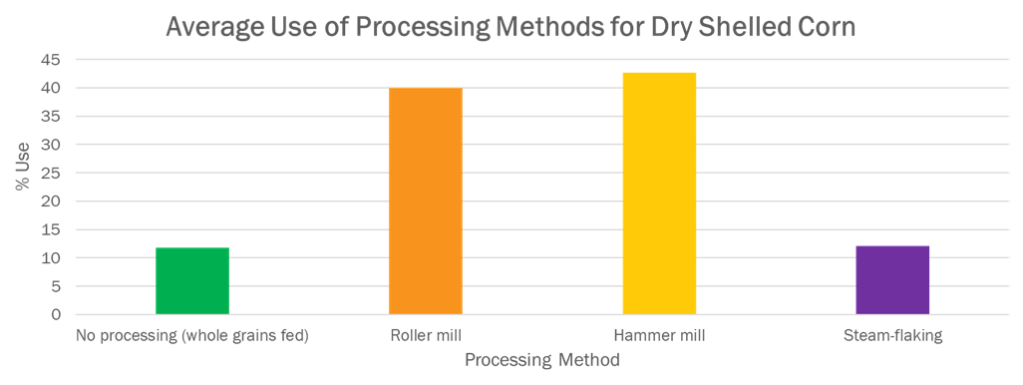
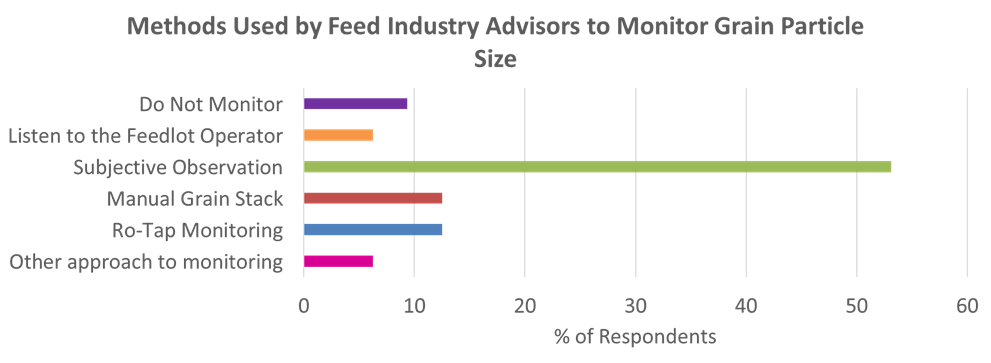
The survey also dealt with grain processing and particle size monitoring. The most common processing methods on Ontario feedlots include hammer and roller milling, but there are a number of producers using whole corn (figure 10). Although some of these feedlots may be on a whole corn and pelleted supplement ration, unprocessed corn can otherwise represent money left on the table in the form of undigested starch. Keep in mind that each of these processing methods can yield big variation in particle size distribution (a function of processing settings, mill maintenance, and fines created through storage and handling) and a balance needs to be achieved between over- and under-processing for rumen health and starch utilization purposes. While there are a number of tools available for monitoring particle size of grains (e.g. Ro-Tap or a manual sieve stack), 53% of respondents indicated that monitoring particle size was left up to visual observation and 9% of respondents do not monitor grain particle size on feedlots at all (figure 11).
Feeding practices for newly received cattle
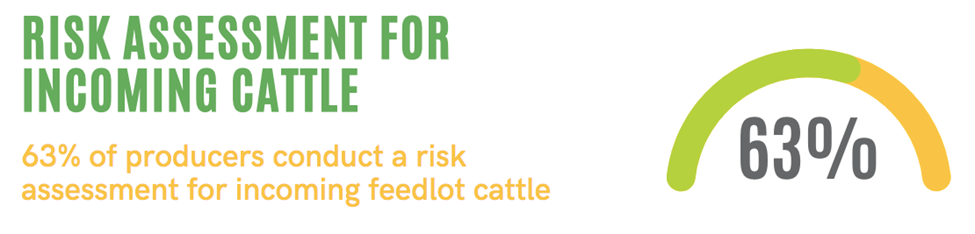
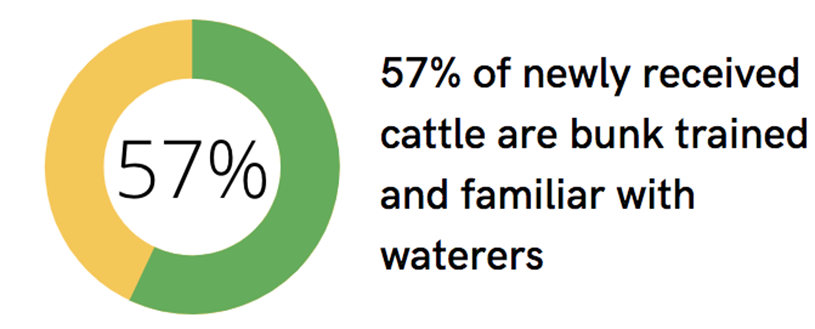
This section addresses specific feeding practices for newly received cattle. This stage of production is of particular interest due to the impact management decisions have on the health and performance of cattle for the duration of the feeding period. Respondents reported that on average 63% of their producer clients conduct a risk assessment on incoming cattle (figure 12) and 57% of newly received cattle, on average, are bunk trained with waterers (figure 13).
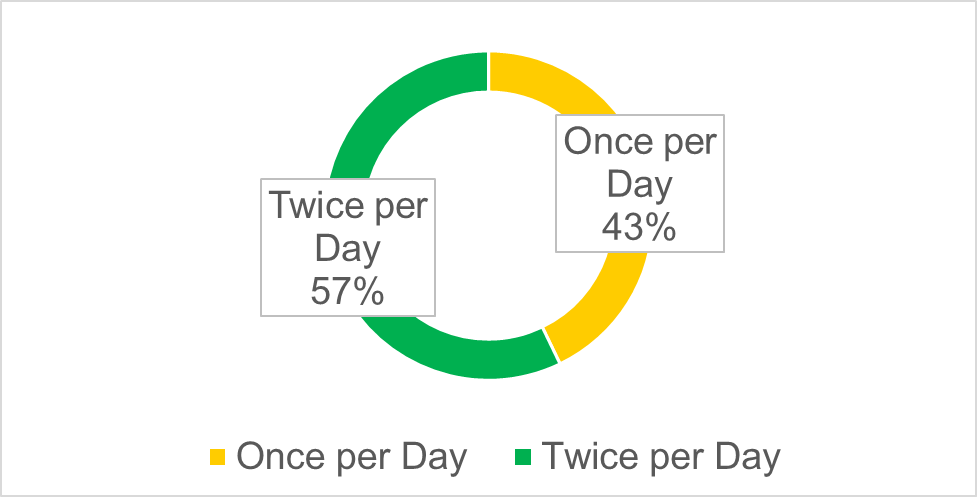
Forty-three percent of feedlot operators are feeding newly received cattle once a day, according to their advisors (figure 14). Frequency of feeding is an element of bunk management known to increase feed intake and maintain consistency in feeding behaviour, where feeding two or more times per day is ideal. This is particularly important for newly received cattle, and especially higher risk cattle, to get started on feed.
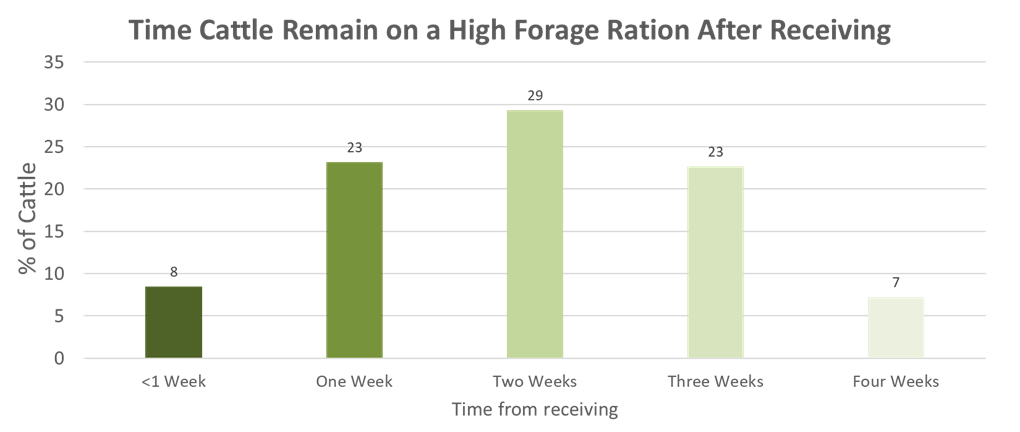
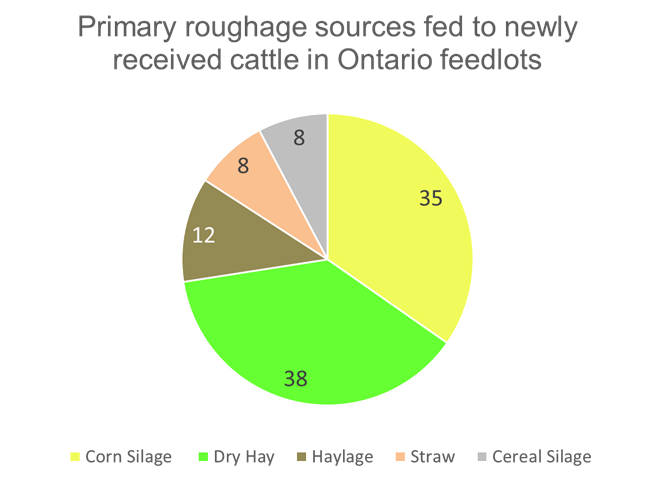
Starting cattle on a high-roughage ration helps to get newly received cattle onto feed and transition to the feedlot environment. The survey intended to capture perceptions on what is considered to be an adequate length of time cattle receive a high-forage ration after receiving. Figure15 shows a bell-curve response to feedback on duration of time cattle are typically on a high-forage ration on feedlots according to respondents’ observations. The majority of respondents indicated their clients with newly received cattle remain on a high forage ration for 2 full weeks or less on average. The type of roughage offered in rations for newly received cattle varies (figure 16), but corn silage and dry hay tend to be the most common roughage sources while other sources include haylage, straw, and cereal silage. Given the high proportion of corn sileage used in starter rations, it is important consider particle size distribution that can affect the contribution to effective fibre by these roughage sources.
Feeding practices for finishing cattle
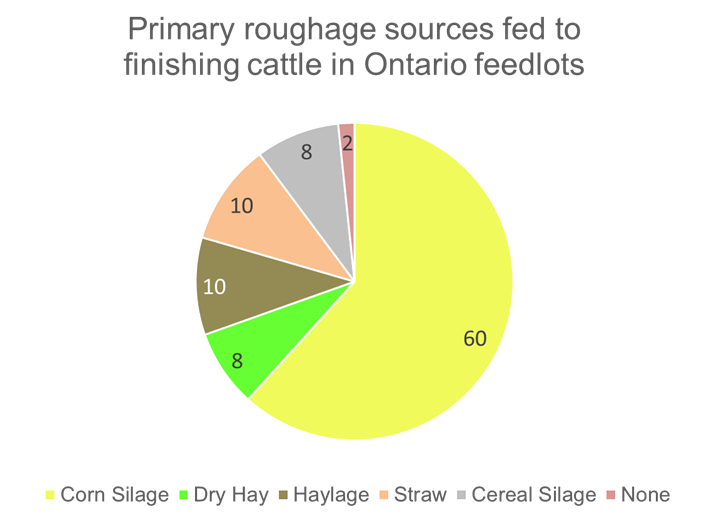
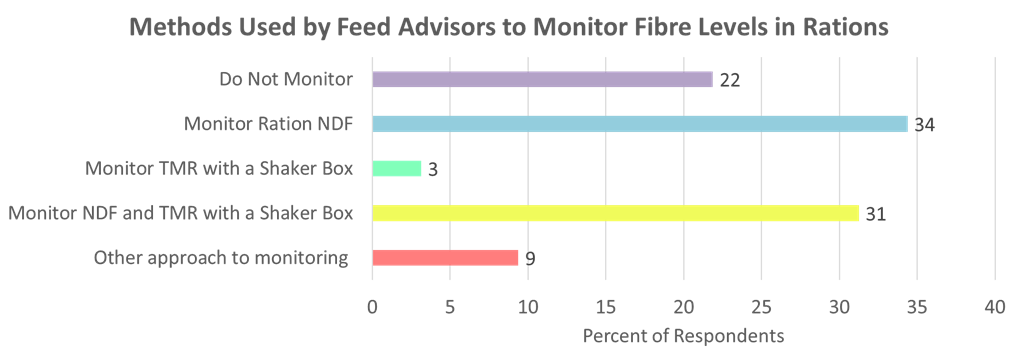
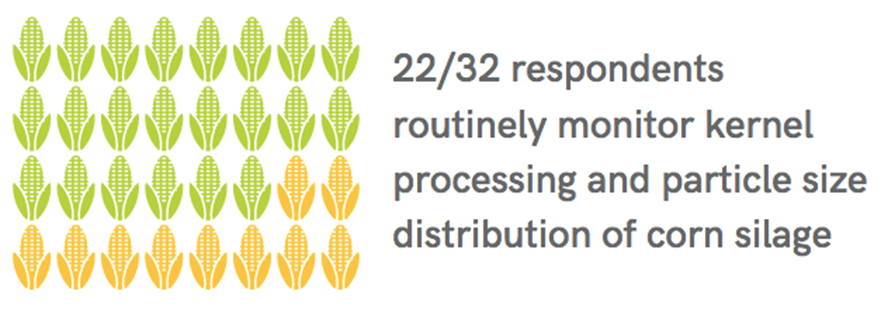
There are different risks for finishing cattle to consider and these are largely associated with feeding high energy rations at this stage of production. Roughage sources for finishing cattle tend to be more highly skewed towards corn silage use (figure 17), but again there are several different feedstuffs used to provide roughage across rations. Here too, particle size of corn silage-heavy rations needs to be considered to understand the level of effective fibre in rations to mitigate risk of digestive upsets. While there looks to be good uptake of ration monitoring practices for effective fibre levels amongst feed advisors (figure 18), there is still a considerable proportion of advisors who are not monitoring effective fibre levels (22%) or solely relying on the chemical fibre fraction, or ration NDF, as a monitoring tool for fibre levels (34%). Keep in mind that effective fibre, or the fraction of the diet that is known to maintain rumen health, is a function of both the chemical fraction (NDF) and the physically effective fraction (pef; obtained from a Penn State Shaker Box). Only about 67% of respondents monitor kernel processing in corn silage for their beef clients (figure 19), another area that can potentially increase value on the feedlot.
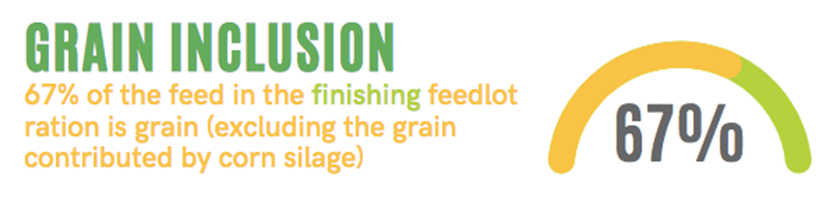
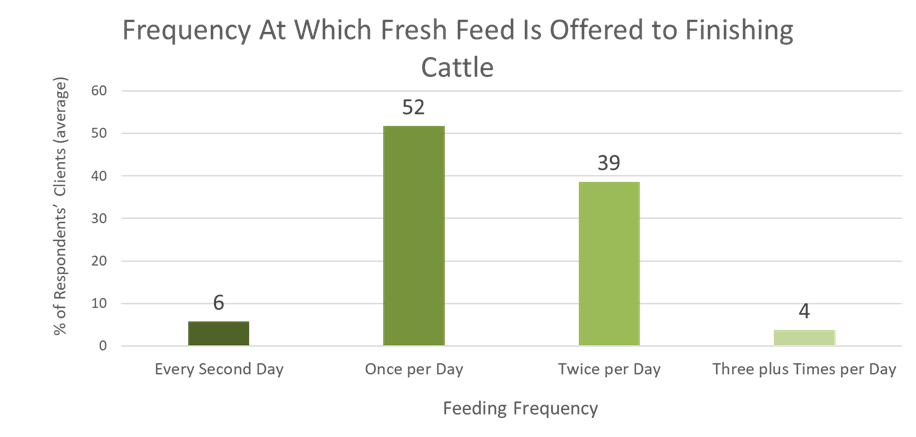
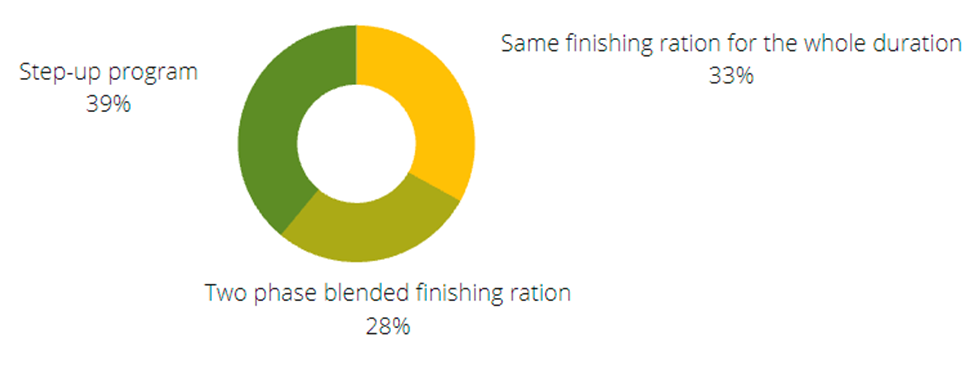
Not surprisingly, respondents indicated that high grain inclusion in finishing rations is typical. On average, 67% of feed in a feedlot ration is grain (excluding grain from corn silage; figure 20). Given this high grain load, it is important to implement practices to control acidosis and liver abscesses, including good bunk management practices. One of the good bunk management practices known to reduce risk of digestive upsets associated with high-grain rations is high feeding frequency (2 times per day or more). Despite the high grain content in feedlot rations, respondents reported that a significant proportion of their feedlot clients are feeding finishing cattle once per day (52%; figure 21). A notable proportion of feedlots (6% on average) offer fresh feed to cattle less than once per day. Similarly, feedback from the survey suggest that there are a significant number of feedlots on a single ration for the duration of the feeding period (28%) or a two-phase blended program (33%; figure 22). This represents another area where there is room for improvement to reduce costs, where a step-up approach allows for more precision in feeding programs by better matching plane of nutrition offered with animal nutrient requirements throughout the finishing period.
The results from this questionnaire offer areas of opportunity for feed industry advisors to increase value on their feedlot clients’ operations as well as for cattle feeders to improve efficiencies and cost-savings on their feedlots.
The authors of this article would like to acknowledge the work and input from contributing team members, including Christoph Wand (Livestock Sustainability Specialist, OMAFRA), Brent Cavell (Quality Assurance Manager; Ontario Corn-Fed Beef Program), Ron Campbell (Operations & Member Service Manager, Ontario Agri-Business Association), and livestock summer students Sedley Benitz and Kathryn Kroeze.
References:
Fox, D. G. and Tedeschi, L.O. 2002. Application of physically effective fiber in diets for feedlot cattle. Publication AREC 02-20, Amarillo: Texas A&M Research and Extension Center
Lundy, E., Loy, D., and Dahlke, G. 2015. Iowa Beef Center: Feed Bunk Management. Iowa State University Extension and Outreach.
Owens, F.N., Secrist, D.S., Hill, W.J., Gill., D.R. 1997. The effect of grain source and grain processing on performance of feedlot cattle: a review. J Animal Sci, 75: 868-879.
Selger, Bill. 2014. Use of grain sieves for evaluation of processed corn grain. Progressive Dairyman.
